
Let Me Walk You Through How I Interpret a Bone Density Scan
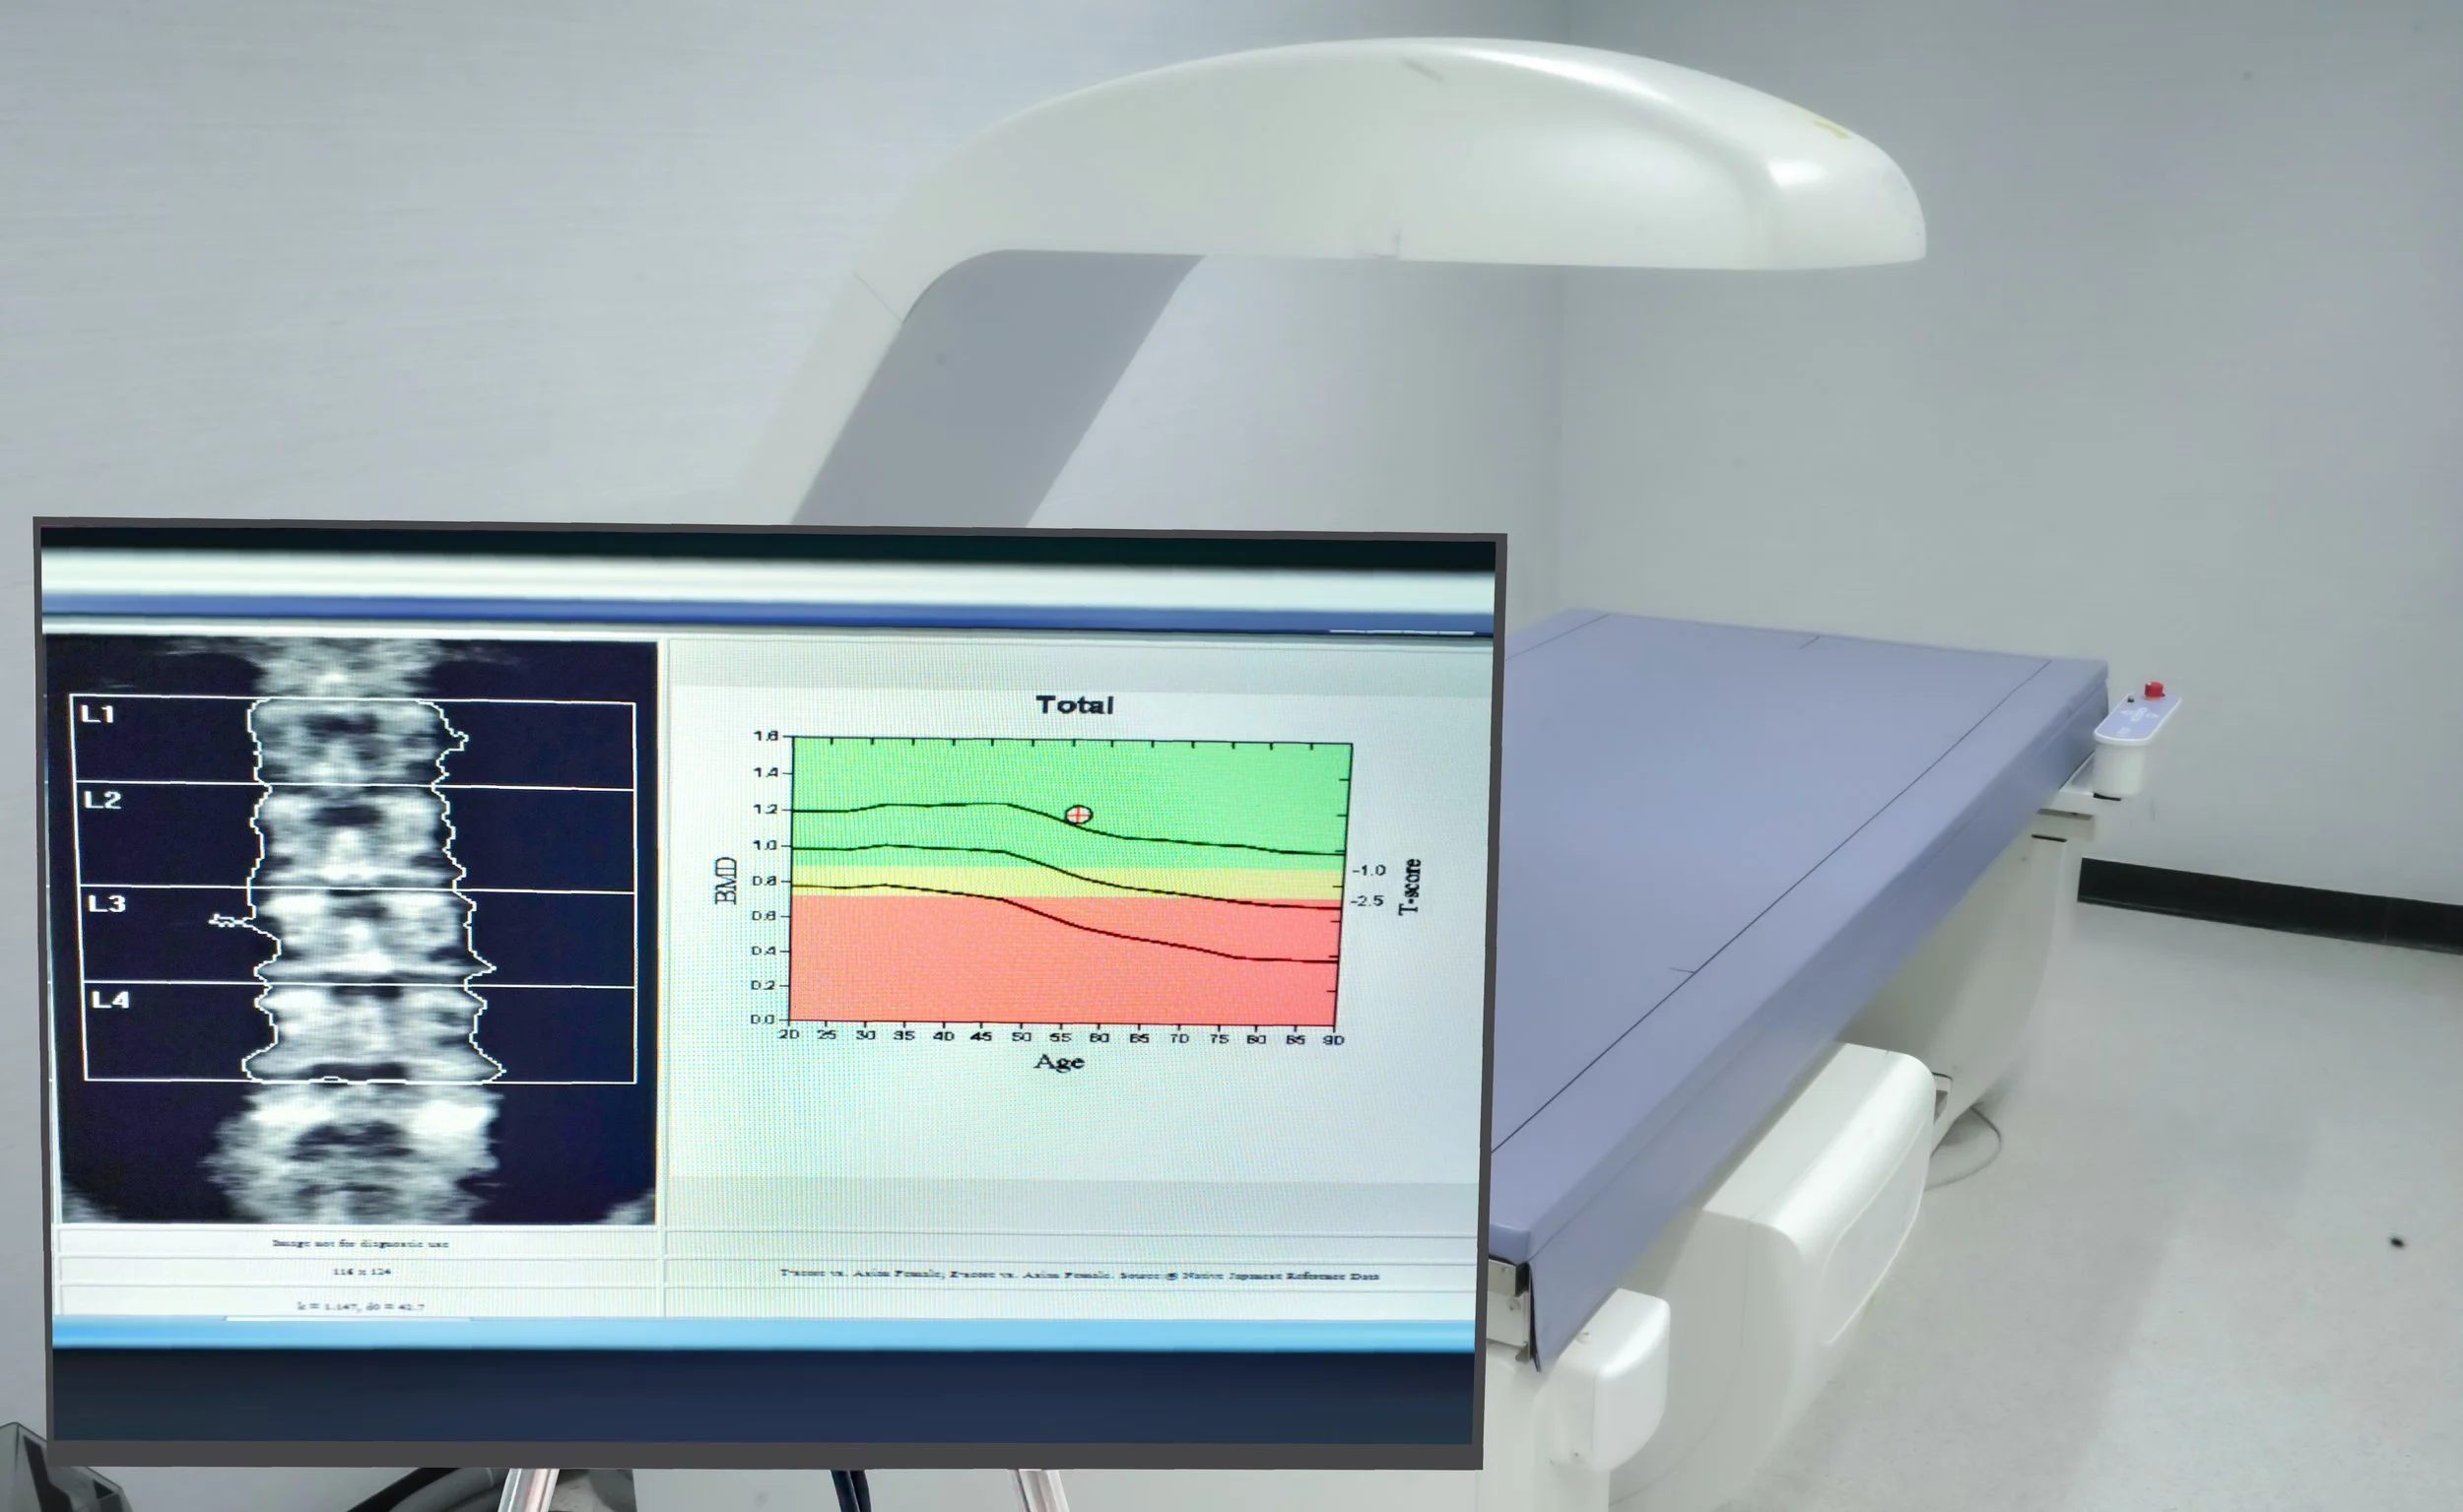
First, what is a bone density scan?
A bone density scan, also called a DEXA scan, measures the strength of your bones. It helps determine whether someone has normal bone density, osteopenia, or osteoporosis.
These conditions are often called “silent diseases” because they usually don’t cause symptoms until a fracture occurs. That’s why screening and early diagnosis are so important.
The goal isn’t just to put a label on your bone density. It’s to identify who is at higher risk for fractures so we can intervene before a fracture occurs.
Before I compare scans, I ask one important question
Were both bone density scans performed on the same machine?
This is very important.
Every DEXA machine is calibrated slightly differently. If you have one scan at one imaging center and your next scan somewhere else using a different machine, it becomes much harder to determine whether your bone density has truly changed or whether we’re simply seeing differences between the machines.
Whenever possible, I recommend having follow-up bone density scans performed on the same machine at the same facility.
Which bones are measured?
Most bone density scans measure three areas:
The lumbar spine (lower back)
The total hip
The femoral neck
Sometimes the distal one-third of the non-dominant forearm
Why these areas?
These are the parts of the skeleton where osteoporotic fractures commonly occur, particularly the hip and spine. Decades of research have shown that bone density measured in these locations provides an excellent estimate of overall fracture risk.
When I review the hip measurements, I’m actually looking at two different numbers.
One is the total hip, and the other is the femoral neck.
Despite its name, the femoral neck has nothing to do with your neck. It’s the narrow portion of the thigh bone just below the ball of the hip joint. This is one of the most common locations for hip fractures, which is why we measure it separately.
What is a T-score?
The T-score is probably the number most patients hear about.
A T-score compares your bone density to that of a healthy young adult who has reached peak bone mass, typically someone in their mid-to-late 20s.
For postmenopausal women and men age 50 and older, this is the score we use to diagnose osteoporosis.
Here’s how it’s interpreted:
Normal: T-score of -1.0 or higher
Osteopenia: T-score between -1.0 and -2.4
Osteoporosis: T-score of -2.5 or lower
A common misconception is that osteoporosis develops overnight.
In reality, bone loss usually occurs gradually over many years. Osteopenia represents reduced bone density that isn’t yet severe enough to meet the definition of osteoporosis, but it still deserves attention because it increases the risk of progressing to osteoporosis over time.
What about the Z-score?
The Z-score is different.
Instead of comparing you to a healthy young adult, it compares your bone density to someone of the same age and sex.
This score is primarily used in:
Premenopausal women
Men younger than 50
Children and adolescents
One of the biggest misconceptions I see is patients being diagnosed with osteoporosis because of a low Z-score, using similar number cutoffs as the T-score.
That’s actually not how we use it.
In younger individuals, we generally do not diagnose osteopenia or osteoporosis based solely on a Z-score.
Instead, if the Z-score is -2.0 or lower, it tells us that the bone density is below the expected range for someone of that age. That finding often prompts us to look for an underlying cause, such as certain medications, hormonal disorders, inflammatory diseases, nutritional deficiencies, or other medical conditions that may be affecting bone health.
I don’t just look at today’s scan—I compare it to prior studies
One of the most valuable parts of interpreting a bone density scan is comparing it with previous scans. I’m looking for trends.
Has the bone density remained stable?
Has it improved?
Or has it declined?
The percentage change from one scan to the next helps answer these questions.
Generally speaking, a change of more than about 3–5% is considered clinically significant. Smaller changes may simply reflect normal variation in the measurement rather than a true change in bone density.
This is another reason why using the same machine for follow-up scans is so important.
What do I hope to see if you’re taking osteoporosis medication?
Many patients assume that treatment should make their bone density “normal” again.
That’s usually not the goal.
The primary goal of osteoporosis treatment is to reduce the risk of fractures.
If medication prevents further bone loss and keeps your bone density stable, that’s often a successful outcome.
Some medications also lead to measurable improvements in bone density, which is wonderful when it happens, but maintaining stability can be just as meaningful.
Remember, we all lose some bone density as we age. That is a normal part of aging.
The objective isn’t necessarily to reverse decades of bone loss. It’s to slow or stop the process enough to keep your bones as strong as possible and reduce your risk of fractures.
My take-home message
When I interpret a bone density scan, I’m not focusing on just one number.
I’m looking at which bones were measured, whether the scan was performed on the same machine as prior studies, whether the T-score or Z-score is the appropriate measurement for that individual, and whether there has been a meaningful change over time.
Most importantly, I interpret the scan in the context of the whole patient—not just the report.
Your age, fracture history, medications, medical conditions, family history, overall fall risk, level of physical activity, and overall fracture risk all matter.
A bone density scan is an important tool, but it’s only one piece of the puzzle.
Understanding what the numbers actually mean can help you make informed decisions about protecting your bone health for years to come.